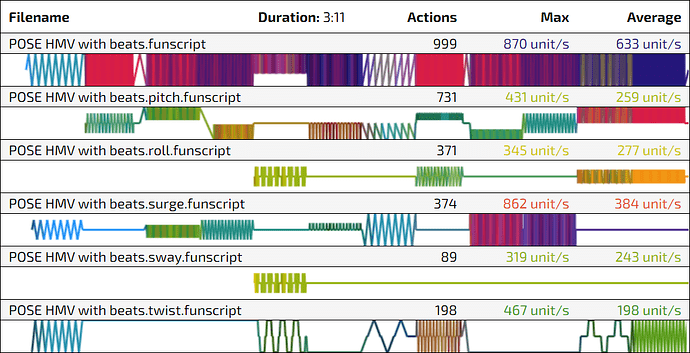
A script heatmap is a visual representation of a funscript, showing the intensity. There are many ways of generating heatmaps for your script and the level of detail varies.
funscript.io
Website for playing and modifying funscripts.
There are several versions of this site:
- funscript.io - Original. Go to Play local script and load a script to generate a heatmap.
- beta.funscript.io - Newer beta version with support for multiple heatmaps sorted by avg speed. Go to List scripts and load scripts to generate heatmaps.
After generating, make a screen dump using a tool or, depending on OS, right-click and save the heatmap as image.
The heatmap will look like this (original and beta site):
![]()
![]()
ScriptPlayer
Windows application for playing funscripts, download here
- Load the script
- Click Generate > Heatmap
The heatmap will look like this:
![]()
OpenFunscripter
Cross-platform application for creating funscripts, download here
- Load the script
- Click Edit > Save heatmap

